

VM-Level Forensics in Azure: Collecting Windows, Linux, and Application Logs Without Logging Into the Machine
- 1 day ago
- 7 min read

Network logs tell you what traffic hit a machine.
Activity logs tell you when it was created and modified.
But neither tells you what happened inside the operating system — which processes ran, which accounts authenticated locally, which files were accessed. For that level of detail, you need OS-level logs, and in Azure collecting those requires an agent running on the VM itself.
The upside is significant:
Azure's diagnostic agent lets you pull Windows event logs and Linux syslog remotely, storing them in a centralized storage account, without needing to RDP or SSH into the compromised machine. For many investigations this means collecting critical OS-level evidence without contaminating the live system or alerting an attacker who may still have access.
Azure VM Diagnostic Agents: A Brief History
Azure has offered several agents for collecting VM metrics and logs over the years. Which agent is in use in your client's environment determines where logs are stored and how to access them.
The Current Agent Lineup
Azure Monitor Agent (AMA) — The current, actively developed agent. Generally available since November 2021. Its key feature is Data Collection Rules, which allow fine-grained control over exactly what data is collected from which machines. Current limitation: it cannot write directly to a storage account or event hub — it sends data to a Log Analytics workspace only.
Windows Azure Diagnostics Extension (WAD) — The older agent Microsoft calls WAD or the Diagnostics Extension. This is the agent that can write directly to a storage account or event hub, making it the only option when you need OS logs in a storage account. Many environments still use WAD.
Log Analytics Agent (MMA — Microsoft Monitoring Agent) — A legacy agent that predates AMA. It sends data to Log Analytics workspaces and is being retired.
📌 Old: The Log Analytics agent (MMA) is being retired by Microsoft. ➜ Updated: Microsoft announced the Log Analytics agent retirement for August 2024. Any environment still using it should have migrated to the Azure Monitor Agent. If you encounter MMA during an investigation, flag it as outdated infrastructure.
💡 Investigator Note: WAD remains relevant for incident response because it is the only agent that can store Windows event logs in a storage account — accessible via Azure Storage Explorer without needing a Log Analytics workspace. Expect to encounter both WAD and AMA in production environments.
📌 Old: The book focuses on configuring WAD via the classic 'Diagnostic settings' menu on the VM. ➜ Updated: In the current Azure Portal, the recommended path is creating a 'Data Collection Rule' under Azure Monitor. The underlying log tables and storage locations remain the same — only the configuration UI changed.
Configuring Windows Azure Diagnostics (WAD)
To collect Windows event logs from a VM using WAD, configure the diagnostic settings for that VM.
Classic Configuration Path
Step 1 — In the Azure Portal, navigate to your VM and select 'Diagnostic settings'
Step 2 — Under the 'Logs' tab, select Windows event log categories and severity levels to collect: Application, Security, and System logs
Step 3 — Under the 'Agent' tab, select the storage account where logs will be written
Step 4 — Optionally set a disk quota to prevent logs from consuming unlimited storage space
New Azure Monitor Path
Step 1 — Search for 'Monitor' in the Azure Portal
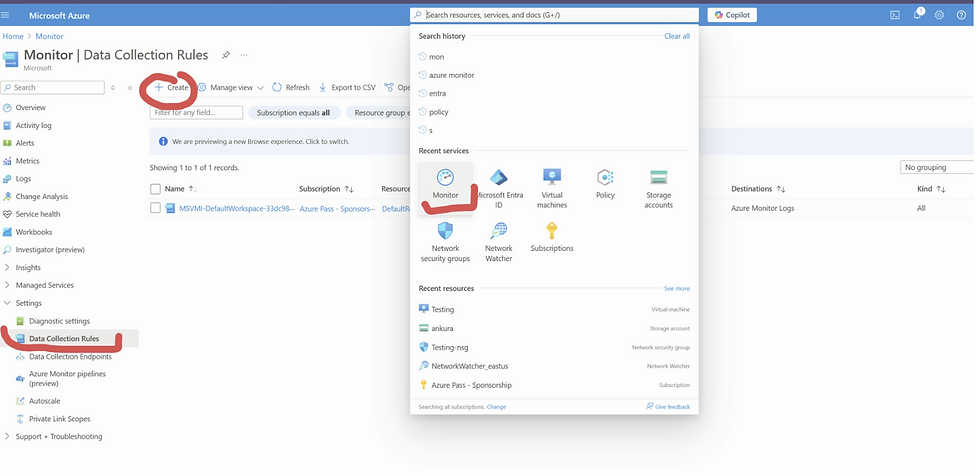
Step 2 — Navigate to 'Data Collection Rules' and create a new rule
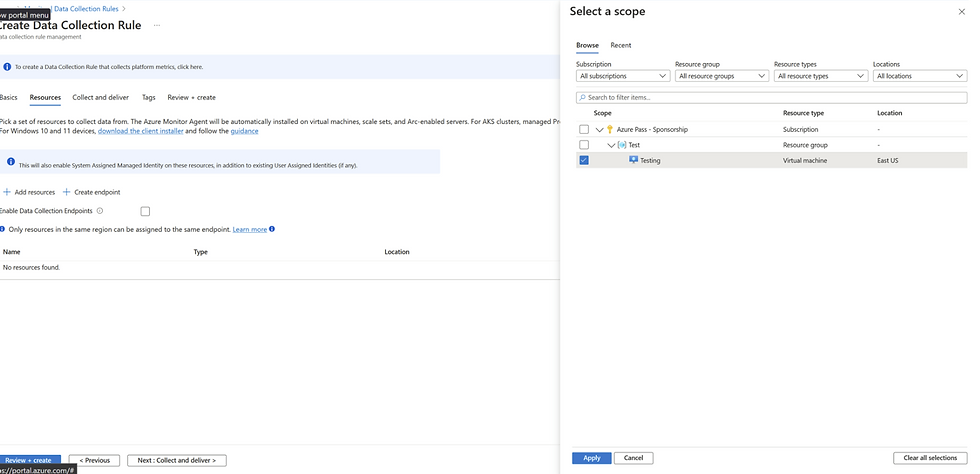
Step 3 — Associate the rule with your target VMs and configure the Windows event log sources and severity levels


For incident response, collect at minimum: Security (All), System (Error, Warning, Critical), and Application (Error, Warning). Collecting all Information-level events generates substantial volume with limited investigative value.
Windows Event Logs: The WADWindowsEventLogsTable
Once WAD is configured and collecting, Windows event logs from your VM are written to a NoSQL table in the specified storage account. The table is named WADWindowsEventLogsTable.
This table cannot be browsed like a blob container. It is a NoSQL table structure and requires Azure Storage Explorer to access properly.
Accessing WADWindowsEventLogsTable with Azure Storage Explorer
Step 1 — Open Azure Storage Explorer and connect to the storage account holding VM diagnostic logs
Step 2 — In the left panel, expand the storage account and navigate to Tables
Step 3 — Locate WADWindowsEventLogsTable
Step 4 — Query or export the table data to CSV for analysis in your preferred tool
The CSV export is the most practical format for feeding into Timesketch, Excel, a SIEM, or any other analysis platform. The table structure closely mirrors the standard Windows Event Log format.
Key Windows Event IDs for Security Investigations
4624 — Successful logon. Look for unusual logon types (Type 3 = network, Type 10 = remote interactive) from unfamiliar IPs or at unusual hours.
4625 — Failed logon. Clusters of failures indicate brute force or credential stuffing.
4648 — Logon using explicit credentials (RunAs). Can indicate lateral movement or privilege escalation.
4720 — A user account was created. Check for backdoor accounts created during the attack.
4732 — A member was added to a security-enabled local group. Attacker adding themselves to Administrators.
7045 — A new service was installed. Common persistence mechanism.
4688 — A new process was created (if process tracking is enabled). Shows what commands were run.
💡 Investigator Note: Process tracking (Event ID 4688) is not enabled by default and must be explicitly turned on via Group Policy. Check whether it is enabled — its presence or absence significantly affects your visibility into what ran on the machine.
Linux Logs: The LinuxSyslogVer2v0 Table
Linux VMs in Azure work similarly to Windows — a diagnostic agent collects syslog data and writes it to a storage account table. Unlike Linux which has separate log files (auth.log, kern.log, syslog), Azure consolidates all Linux log data into a single table: LinuxSyslogVer2v0.
Configuring Linux Syslog Collection
Navigate to the VM's Diagnostic Settings in the Azure Portal
Under the 'Syslog' tab, select the syslog facilities you want to capture (kern, auth, syslog, etc.) and the minimum severity level
Select the storage account destination
Under the 'Metrics' tab you can configure collection of system performance data: CPU utilization, memory, network I/O, disk I/O. Metrics can corroborate investigation findings — a crypto miner shows sustained high CPU, and ransomware encrypting files produces distinctive disk activity spikes.
Accessing Linux Logs with Azure Storage Explorer
Open Azure Storage Explorer
Navigate to Tables under the appropriate storage account
Locate LinuxSyslogVer2v0
Export to CSV for analysis
For security investigations, the auth facility is your highest priority — it captures all authentication events, sudo usage, and PAM activity.
Key things to look for in Linux syslog:
SSH authentication events — successful and failed logins via sshd
sudo usage — any command run with elevated privileges
New user creation — useradd or adduser commands in auth.log
Cron job additions — new cron entries for persistence
Unusual process execution patterns in syslog
Application Logs: IIS and Custom Tracing
IIS Logs
For Windows VMs running Internet Information Services as a web server, WAD can collect IIS access logs. Unlike other log types that go to NoSQL tables, IIS logs are stored as plaintext files in blob storage — making them immediately accessible with standard log analysis tools.
IIS logs follow the W3C extended log format with fields including:
date and time of the request
client IP address (c-ip)
HTTP method (cs-method: GET, POST, etc.)
URI stem and query string (cs-uri-stem, cs-uri-query)
HTTP status code (sc-status)
User agent string (cs(User-Agent))
Bytes transferred (sc-bytes, cs-bytes)
For web application attack investigations, IIS logs are your primary evidence source. They show SQLi attempts, path traversal attacks, webshell access patterns, POST requests used to upload malicious files, and User-Agent strings that identify automated attack tools.
Custom Application Logs and ETW
Windows applications can generate diagnostic tracing via the .NET tracing framework. Azure's diagnostic agent can also capture Event Tracing for Windows (ETW) events — a low-level Windows mechanism for capturing kernel and application events.
ETW events are primarily useful when investigating an application-layer incident where the developers have instrumented their code with ETW tracing. During a standard intrusion investigation, you are unlikely to prioritize ETW unless the application itself is the specific target.
💡 Investigator Note: If you are investigating a web application compromise, ask the development team whether they have custom application logging configured. Developers often add detailed logging that captures business logic events — which user did what at what time — that never appears in any Azure native log.
Log Source Audit Checklist
Before closing any Azure investigation, run a log source audit:
Tenant logs (Entra ID sign-in + audit) — ON by default. 30-day portal limit — confirm if exported to workspace or storage.
Subscription logs (Activity log) — ON by default. 90-day default retention — confirm if exported.
NSG flow logs — OFF by default. Confirm Version 2 is enabled for each NSG in each region.
Storage account access logs (StorageRead/Write/Delete) — OFF by default. Check each relevant storage account.
VM Windows event logs (WADWindowsEventLogsTable) — OFF by default. Confirm agent is installed and configured.
VM Linux syslog (LinuxSyslogVer2v0) — OFF by default. Same as above.
IIS logs — OFF by default. Enable if web servers are in scope.
For any log source that is off: document it, turn it on immediately to capture going forward, and note in your investigation report that evidence for the prior period is unavailable. This is a finding your client needs to remediate.
In the final article, we put all of this together and walk through the complete process of acquiring a forensic image of a compromised Azure VM — without downloading it, without disrupting operations, and entirely within the cloud.
Special Thanks
I would like to extend my heartfelt gratitude to one of my dearest Friends, a Microsoft Certified Trainer, for her invaluable assistance in creating these articles. Without her support, this would not have been possible. Thank you so much for your time, expertise, and dedication!
Next Article

Comments