Moving Forward with Memory Analysis: From Volatility to MemProcFS Part 1
- Dec 29, 2025
- 6 min read

If you’ve been following my Memory Analysis series, you may remember that I previously covered the initial investigation steps in detail in the article:
“Step-by-Step Guide to Uncovering Threats with Volatility: A Beginner’s Memory Forensics Walkthrough”
Volatility is one of my favorite memory forensics tools.
I genuinely love working with it—it makes complex investigations much easier and provides incredible visibility into system memory.
However, Volatility is not the only powerful tool available.
Another tool I frequently use and really enjoy is MemProcFS. It’s an excellent memory forensics framework that approaches investigations in a more interactive and intuitive way by exposing memory artifacts through a virtual file system.
So, rather than repeating the Volatility workflow:
If you want to learn or revisit memory investigation using Volatility, I recommend checking out the article linked above.
If you want to see how to perform a similar investigation using MemProcFS, stay with me—I’ll guide you through it step by step.
Before we begin, if you’re not familiar with MemProcFS or MemProcFS Analyzer, I strongly recommend reading the following article first:
With that covered, let’s get started.
MemProcFS Overview
MemProcFS dynamically performs symbol table lookups from Microsoft servers to correctly identify the memory image profile. For best results, it’s recommended to use a system with active Internet connectivity.
The -device argument specifies the path to the memory image.
MemProcFS.exe -device C:\Users\Akash\Downloads\laptop.raw -forensic 1 -license-accept-elastic-license-2.0Optionally, you can also provide paths to pagefile.sys and swapfile.sys using the -pagefile[0|1] parameters.
This is considered a best practice, as MemProcFS supports pagefile parsing and can decompress compressed memory regions, which are common in Windows 10 and Windows 11 systems.
These capabilities are particularly impressive and are one of the main reasons MemProcFS often extracts more forensic artifacts from memory than many other tools.
On Windows systems, the default mount point is the M: drive.

This can be changed using the -mount option, which is also required when running MemProcFS on Linux to specify a mount path.
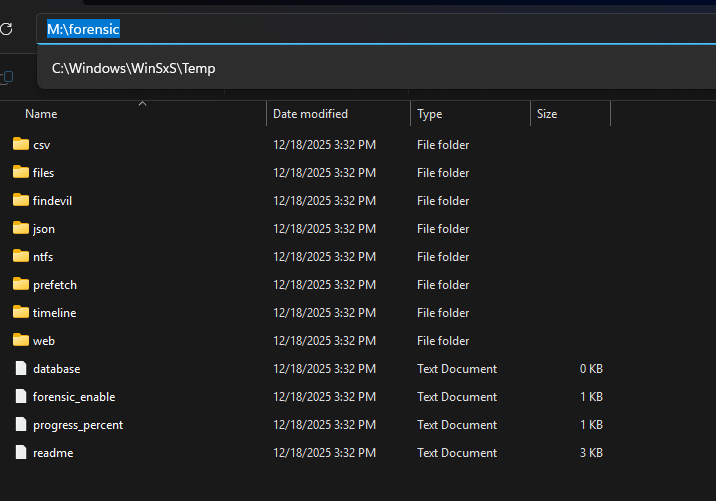
An additional useful option is -forensic. This flag automatically triggers forensic plugins such as:
findevil
ntfs
timeline

While these plugins are more resource-intensive, they often complete faster than expected and immediately generate valuable forensic data. Once MemProcFS is running, keep the terminal open and navigate to the mounted drive to begin analysis.
Exploring Processes with MemProcFS
Once mounted, analyzing memory artifacts is as simple as browsing a file system.
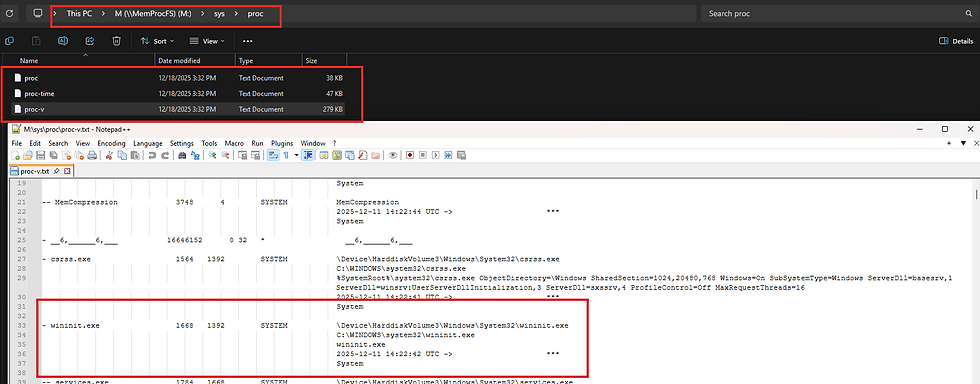
For example, process information can be reviewed via:
M:\sys\proc\proc.txtThis file provides a parent/child process tree view, similar to the windows.pstree output in Volatility.

In addition to familiar information, MemProcFS includes extra details such as:
The user account running the process
A flag column indicating potential anomalies

Common Process Flags
32 – 32-bit process running on a 64-bit system
E – Process not found in the EPROCESS list (possible unlinking or memory corruption)
T – Terminated process
U – User-level (non-system) process
* – Process running from a non-standard path
You’ll often notice multiple output files in directories of interest. For instance, proc-v.txt provides a more verbose process listing, including full paths and command-line arguments

While this format is slightly harder to read as a tree, it’s extremely valuable for deeper analysis.
Processes can also be investigated directly by name or PID, which we’ll look at shortly.
Deep-Diving into a Process
Unlike Volatility, which relies on separate plugins to extract process details, MemProcFS consolidates all related artifacts into structured folders.
For example, after identifying a suspicious process named Move Mouse.exe with PID 16032 , we can navigate to:
M:\name\Move Mouse.exe-16032
Within this directory:
win-cmdline.txt shows the full command line from the process PEB
The token folder provides information about the security context and privileges
The handles folder lists open handles
The modules folder contains loaded DLLs and the process image
As you explore these directories, you’ll not only see metadata but often reconstructed artifacts themselves.
For instance, each DLL folder under modules includes a pefile.dll file, which attempts to reconstruct the original DLL directly from memory.

These files can be opened in a hex editor, disassembler, or submitted to a sandbox for further analysis.
Network Artifact Analysis
Identifying network activity using MemProcFS is equally straightforward. Under:
M:\sys\net
you’ll find:
netstat.txt – traditional network connection view
netstat-v.txt – extended view with full process paths

Since these are plain text files, they’re easy to search and filter.
For example, you can quickly scan for known malicious IP addresses or suspicious process names using standard command-line tools like grep.
-------------------------------------------------------------------------------------------------------------
Now that we understand process memory layout and behavior, we can move on to one of the most important stages of memory analysis:
Identifying code injection artifacts using MemProcFS.
MemProcFS currently centralizes its detection logic into a single, powerful plugin called findevil.

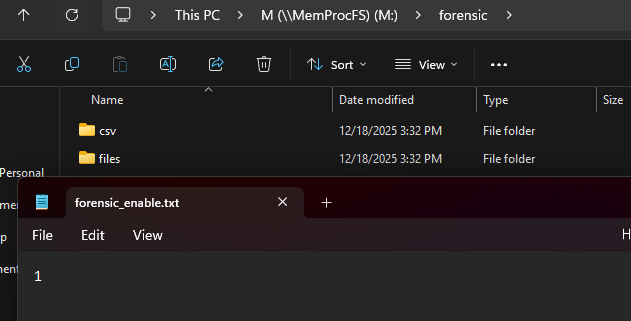
This plugin is not enabled by default and must be activated in one of the following ways:
Launch MemProcFS with the -forensic command-line argument, or
-forensic 1 -license-accept-elastic-license-2.0Write the value 1 into the file:
M:\forensic\forensic_enable.txt

It’s important to note that findevil only works on Windows 10 and newer systems, as this limitation helps reduce false positives caused by older memory management behaviors.
Once enabled, MemProcFS generates a report at:
M:\forensic\findevil.txt
This report flags suspicious memory locations using a set of well-defined indicators, which we’ll break down below.
Process-Level Anomaly Detections
The first group of findevil detections focuses on process irregularities, many of which should already feel familiar from earlier stages of memory analysis:
PROC_NOLINK : Indicates a process that is missing from the EPROCESS doubly-linked list. This may be caused by normal termination, memory corruption, or malicious unlinking (DKOM).

PROC_PARENT : Flags deviations from expected parent-child relationships for known system processes.
PROC_USER : Detects system-named processes running under incorrect or unexpected user tokens.
These flags help establish early suspicion before diving deeper into memory-page analysis.
Memory Page Injection Indicators
The next—and arguably most powerful—set of detections focuses on suspicious memory page properties. Understanding how Windows maps memory is crucial for interpreting these flags correctly.
PE_INJECT :
What it means:
A memory region contains a valid PE header (EXE or DLL), but was not loaded from disk.
NOIMAGE_RWX : RWX memory pages that are not backed by image-mapped files.
What it means:
Memory pages have Read + Write + Execute permissions AND They are not backed by an image file
Why this is bad:
Legitimate code should never be RWX
RWX memory allows:
Writing shellcode
Executing it immediately

NOIMAGE_RX : RX memory pages outside image-mapped memory.
What it means:
Memory pages are Executable (RX) but not image-mapped
Why suspicious:
Code is executing
But it didn’t come from a loaded EXE or DLL
Less severe than RWX, but still suspicious:
Malware may write code, then change permissions to RX
Used to evade RWX detection
PRIVATE_RWX : RWX permissions inside private memory regions (heap or stack).
What it means:
RWX memory inside private memory(heap or stack)
Why this matters:
Heap/stack are meant for data, not code
RWX heap/stack almost always indicates:
Shellcode execution
Exploit payloads
Memory injection
PRIVATE_RX : RX permissions inside private memory.
What it means:
Executable memory (RX)inside private memory (heap or stack)
Why suspicious:
Code running from heap/stack is abnormal
Often used after:
Shellcode is written
Permissions changed from RW → RX
------------------------------------------------------------------------------------------------------------
Indicator | Executable | Writable | Image-Mapped | Risk |
PE_INJECT | ✅ | varies | ❌ | High |
NOIMAGE_RWX | ✅ | ✅ | ❌ | Very High |
NOIMAGE_RX | ✅ | ❌ | ❌ | High |
PRIVATE_RWX | ✅ | ✅ | ❌ | Very High |
PRIVATE_RX | ✅ | ❌ | ❌ | Medium–High |
------------------------------------------------------------------------------------------------------------
These detections are extremely valuable because injecting code is easy, but placing it correctly with legitimate characteristics is very hard. As a result, multiple detections often trigger on the same malicious memory region.
For example:
A PE header (MZ) located in an RX page outside image-mapped memory would trigger both PE_INJECT and NOIMAGE_RX.
While false positives still exist, these detections represent a major improvement over Volatility’s malfind, particularly when layered together.
Detection of Manipulated Memory Structures
Beyond raw injection detection, findevil also identifies manipulated memory structures, which are often used in more advanced attacks.
PEB_MASQ : Detects Process Environment Block masquerading, where malware alters the process name or file path in the PEB.
PE_NOLINK : Identifies DLLs with valid PE headers present in the VAD but missing from the PEB module lists—very similar in concept to Volatility’s ldrmodules. While false positives exist, including pagefile data significantly reduces noise.
PE_PATCHED : Flags executable pages that were modified after being loaded. This is common in:
Advanced process hollowing
AMSI bypasses
In-memory patching
This detection relies on page table entries (PTEs)—specifically prototype PTEs—which track modified image pages. While extremely powerful, this detection can be noisy on systems using:
SysWOW64 (32-bit code on 64-bit systems)
JIT compilers (e.g., .NET and PowerShell)
Expect noise—but also expect ground-truth accuracy.
------------------------------------------------------------------------------------------------------------
What’s Next?
In the next article, we’ll continue:
Stay tuned—this is where the investigation gets really interesting


Comments