

Examining SRUM with ESEDatabaseView
- May 24, 2024
- 5 min read
Updated: Feb 27

Updated on 26 Feb, 2026
If you waana know more about SRUM do checkout my previous articles!
Intro
You've heard about SRUM. You know it tracks application usage, network activity, and energy data going back 30 days. But knowing it exists and actually getting useful evidence out of it are two different things.
In this article we're going to walk through the whole process from scratch
We're using ESEDatabaseView by NirSoft because it's free, doesn't require installation, and gives you direct access to every table in the raw database. It's the best tool for understanding what SRUM actually contains before you move on to automated parsers.
Section 1 — The Full Workflow at a Glance
Before we go step by step, here's the full picture. There are six stages to a SRUM analysis using ESEDatabaseView. Each one feeds into the next, and skipping any of them — especially the repair check — can cause problems further down the line.
Section 2 — Step 1 & 2: Collect the Files and Check for Dirty State
The SRUM database lives at
C:\Windows\System32\sru\SRUDB.dat. On a live running system, Windows has this file locked — you can't just browse to it and copy it with File Explorer.
You'll need either a forensic imaging tool or Kape, a live triage script, or a tool like SRUM-DUMP that handles the locked file access for you.
You also need a second file: the SOFTWARE registry hive at
C:\Windows\System32\config\SOFTWARE You'll need this later to resolve network names from the L2ProfileId values you'll find in the database. Grab both at the same time.
Once you have your copies, the very first thing to do before opening ESEDatabaseView is check whether the database was closed cleanly. ESE databases can end up in a "dirty" state if the system was powered off abruptly, crashed, or was seized while running — which happens a lot in real incident response. If you try to open a dirty database in ESEDatabaseView, you'll either get an error or see incomplete, unreliable data. Check first, always.
Section 3 — Step 3: Opening SRUDB.dat in ESEDatabaseView
Download ESEDatabaseView from NirSoft — it's a small portable executable, no installation needed. Run it as administrator.

To open the database: File → Open → navigate to your SRUDB.dat copy → click Open.
The tool will load the database and show you a table browser. By default it opens to a system table called MSysObjects — this is just the database's internal index of all its own tables and you don't need to worry about it. What you do want to look at is the combo box just below the toolbar, which lists every table in the database. Click on it and you'll see all the tables available — typically 16 in a modern Windows 10 or 11 SRUDB.dat.
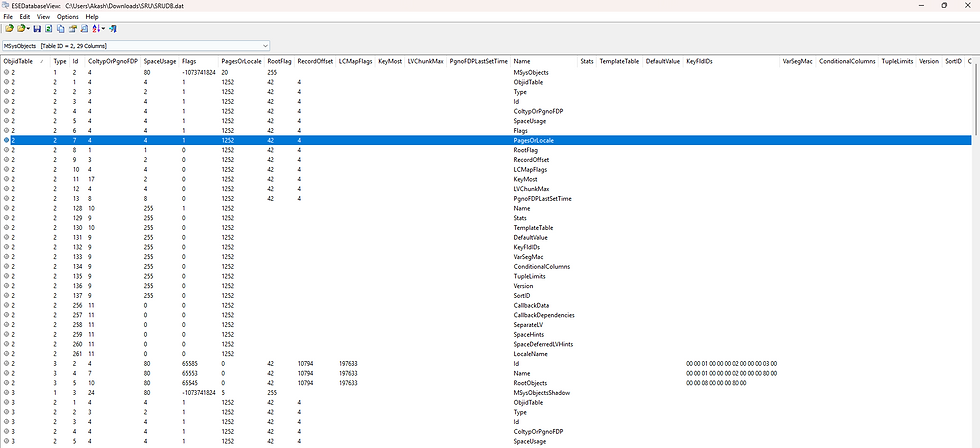
Each table has a GUID as its name. Most of them won't mean anything at first glance, but you'll quickly learn the three or four that matter. The column headers in each table are the field names, and you can click any header to sort by that column — useful when you're trying to find entries for a specific time window or a specific application.

One thing to keep in mind as a beginner: the data in some fields looks like raw numbers or index values. That's intentional — the database stores references, not human-readable values. Part of what we're going to cover is exactly how to decode those references into something meaningful.
Section 4 — Step 4: Reading the Network Data Usage Table
Select {973F5D5C-1D90-4944-BE8E-24B94231A174} from the table dropdown — this is the Network Data Usage Monitor, and it's usually where you start.
Each row in this table represents one application's network activity during one recorded hour. The columns you'll immediately notice are things like AppID, UserId, BytesSent, BytesRecvd, InterfaceLuid, and L2ProfileId. Some of these are immediately meaningful — BytesSent and BytesRecvd are exactly what they sound like. Others need decoding.
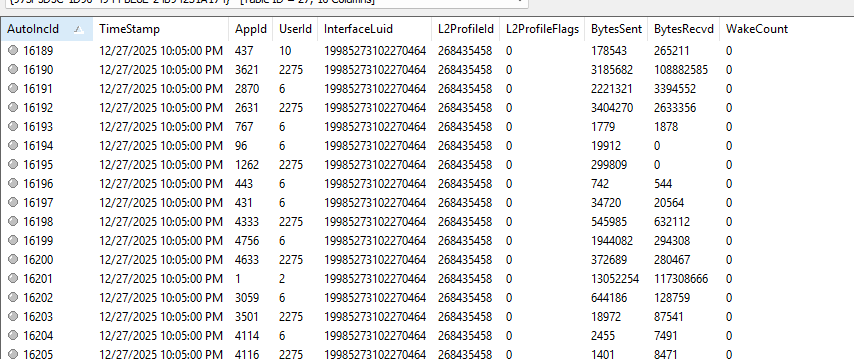
AppID is just a number — it's an index that points to another table. UserId is a numeric reference too. L2ProfileId is a number that refers to a specific Wi-Fi or network profile. InterfaceLuid encodes the type of network interface (Wi-Fi, Ethernet, or something like Point-to-Point Protocol).
Don't be put off by the raw numbers. The next few steps show you exactly how to decode each one into something human-readable. Think of this table as the hub — everything else connects back to it.
Section 5 — Step 5: Correlating Fields Across Tables
This is the step where everything comes together. You have two things to resolve from the network table: what application AppID 3621actually is, and what network L2ProfileId 268435458 actually refers to. Here's how to do both.

To decode an AppID: switch to the SruDbIdMapTable in the table dropdown. Find the row where IdIndex equals your AppID — in this case 3621.

The IdBlob column in that row contains a Unicode string (UTF-16 Little Endian) with the full path to the executable. That's your application.
If you see C:\Windows\SysWOW64\audiodg.exe, you now know exactly what was generating that network traffic.
To decode an L2ProfileId: this one requires leaving ESEDatabaseView and opening the SOFTWARE registry hive. Open it in Registry Explorer (or regedit if you're working on a live system), navigate to
SOFTWARE\Microsoft\WlanSvc\Interfaces\find the GUID that has a Profiles subkey, and browse the profile entries until you find one whose ProfileIndex value matches your L2ProfileId.


Then expand that profile → MetaData → look at the Channel Hints value. That hex value decodes to the human-readable network name — the actual Wi-Fi SSID.

Once you have both pieces, go back to your original network table row and you can now read the full picture: audiodg transferred inbound and outbound on the [Network name] network at [Tim and date], under user account ID 2275.
Section 6 — Step 6: Export and Build Your Timeline
Once you've done your correlation work, the last step is getting the data out of ESEDatabaseView into a format you can actually work with and report from.
In ESEDatabaseView, go to File → Export Current Table. You can export as a comma-delimited text file (CSV) or tab-delimited. Export the tables you've been working with — at minimum the Network Data Usage table and the SruDbIdMapTable. Then open them in Excel or your preferred spreadsheet tool.
In Excel, you can do the AppID resolution yourself using VLOOKUP — put the SruDbIdMapTable on one sheet, use VLOOKUP to pull the IdBlob (executable path) into the network table using AppID as the key. Do the same for your network name resolutions. Now every row in your network table has a human-readable application name and a human-readable network name instead of raw index numbers.
--------------------------------------------------------Dean--------------------------------------------

Comments