

Moving Forward with Memory Analysis: From Volatility to MemProcFS : Part 2
- Dec 31, 2025
- 6 min read

One of the most exciting upgrades to MemProcFS is the native integration of YARA signature scanning.
By combining the power of YARA-based detection with deep memory inspection, MemProcFS makes it surprisingly easy to detect even highly stealthy malware variants. When enabled, YARA hits are surfaced at the very top of the FindEvil output, which is exactly where they belong—since these detections often act as the starting point for deeper analysis.
Expanded Coverage: Processes and File Objects
Initially, YARA scanning focused on process memory, but it has now expanded to include file objects as well. This significantly improves detection of threats such as:
Malicious loaded drivers
Vulnerable or abused kernel drivers
File-backed malware hiding in memory
Enabling YARA Scanning in MemProcFS
MemProcFS with the Elastic Security open-source YARA ruleset, which contains 1,000+ high-quality rules capable of detecting multiple variants of some of the most common malware families seen in the wild.
To use these rules, you must accept the Elastic license:
MemProcFS.exe -device <.img> -forensic 1 -license-accept-elastic-license-2-0Important:
Enabling YARA scanning will delay the availability of forensic results. This is expected—YARA scanning is resource-intensive, especially on large memory images.
Be patient; results typically appear after several minutes.
Understanding YARA Output in MemProcFS
Once scanning completes, YARA results are integrated directly into the forensic output:
Primary results: M:\forensic\csv\findevil.csv
Detailed YARA output: M:\forensic\csv\yara.csv

Within findevil.csv, YARA detections appear under multiple YR_* categories.

Each hit includes a description pulled directly from the YARA rule, which is extremely useful when:
Investigating false positives
Reviewing how a rule works
Searching for rule context online
Each hit is cross-referenced using an index number (e.g., [0]) that maps directly to detailed entries in yara.csv.

When “Too Many Hits” Is Actually Normal
You may sometimes see an unexpectedly high number of YARA hits for a single process.
This is completely normal. Antivirus and security tools often match against malware signatures by design. For this reason, some processes—such as MsMpEng.exe (Microsoft Defender)—are excluded by default.
Using Your Own YARA Rules
If you prefer to use a custom YARA ruleset, MemProcFS supports this via:
-forensic-yara-rulesYou can point it to:
A single YARA rule
A YARA rule index file
Custom rule results are stored separately in:
M:\forensic\yara\
Key files include:
match-count.txt – total number of matches
result.txt – detailed hit information (including process context)
What Comes After Detection?
Finding suspicious memory regions naturally raises the question:
“What do I do next?”
Because false positives are common at the memory level, further validation is often required. That said, sometimes the evidence speaks for itself.
For example:
svchost.exe running from the wrong directory
Incorrect parent process
Clear signs of process hollowing
In cases like this, you may already have enough proof of compromise.
When deeper analysis is required, memory forensics truly shines—allowing you to investigate far beyond what traditional endpoint tools can provide.
Dumping and Recovering Suspicious Memory
As you investigate, document everything, including:
Process names and PIDs
Virtual memory addresses
VAD path information
MemProcFS conveniently includes all of this in the findevil output.
To recover suspicious artifacts:
Navigate into the process directory
Open the files folder

Review subfolders created from:
Handles
Loaded modules (EXEs, DLLs, drivers)
Extracted VAD pages
Investigating Injected Code
The vmemd folder is especially valuable when dealing with injected shellcode or memory-only payloads. Files here appear as:

*.vvmem
These memory segments can be:
Copied out for offline analysis
Opened directly in a hex editor
Your goal is to locate memory regions matching suspicious virtual addresses or object names—such as a previously identified hollowed DLL.
Handling False Positives Like a Pro
Memory forensics is never simple.
Some activity looks malicious but is completely normal, while real malware often tries to blend in.
MemProcFS findevil output—much like Volatility’s malfind—can generate many false positives.
A classic example is PE_PATCHED, which is notorious for false alerts due to:
.NET Just-In-Time (JIT) compilation
Runtime code modifications
Web browsers and PowerShell behavior
SysWOW64 (32-bit) components on 64-bit systems
Processes such as:
PowerShell
Outlook
Browsers
msiexec.exe
should always be reviewed carefully—but not blindly assumed malicious.
********************************************************************************************************************
Baseline Is Everything
One of the best practices in memory forensics is to run tools like malfind and findevil against a known-good baseline image. This helps you understand what “normal” looks like for a given OS version and dramatically reduces investigation time during real incidents.'
********************************************************************************************************************
Before We Continue: Important Note on Memory Object Extraction
Before we jump into the next part, there’s an important note.
The next topic focuses on extracting memory objects, and I’ve already written a dedicated article on this:
“Extracting Memory Objects with MemProcFS / Volatility 3 / Bstrings: A Practical Guide”
If you’re interested in a comparison across tools, feel free to check out that article using the link below.
However, in this series we’re focusing purely on MemProcFS. That means some concepts will be repeated. But honestly—revisiting fundamentals isn’t a bad thing at all (learning twice never hurts 😄).
Extracting Memory Objects in MemProcFS
MemProcFS makes memory object extraction extremely straightforward. Memory objects are exposed as individual files inside a virtual filesystem, allowing you to either:
copy them out for offline analysis, or
analyze them directly in place.
The biggest challenge is not extraction itself—it’s knowing where to look.
Common Memory Object Locations in MemProcFS
Paths:
M:\<process>\vmemd                                <Per VAD / PTE>
M:\<process>\heaps                                <Private memory>
M:\<process>\minidump\minidump.dmp                <Unified process memory>
Executables and DLLs <Image-mapped memory>
M:\<process>\modules\<module_name>\pefile.dll
M:\<process>\files\                              (modules | vads)
Drivers
M:\name\System-4\modules\<driver_name>\pefile.dllCached and Forensic Files
M:\forensic\files               <Cached Files>
M:\forensic\ntfs                <MFT>
Registry, Services, and Tasks
M:\registry                     <Registry>
M:\sys\services                 <Services>
M:\sys\tasks                    <Tasks>
Understanding the Process Folder Structure
Most process-related artifacts live under the process directory, which can be accessed by:
Process name: M:\name\Move Mouse.exe-16032\

PID: M:\pid\16032

Both paths are cross-linked and contain identical data.
Once inside a process folder, you’ll find several key subfolders:
vmemd : Useful for tracking specific memory regions (for example, those flagged by FindEvil).
heaps : A powerful location for searching private memory heaps, where processes store most of their runtime data.
minidump : Provides a compact but practical view of process memory, including stack, heap, executable, and loaded DLLs.
modules : Contains loaded DLLs and the process executable, each represented as a pefile.dll
Why MemProcFS Is So Powerful for Extraction
One of the most unique aspects of MemProcFS is that it virtualizes memory into a navigable filesystem.
This means you can:
open memory sections in a hex editor,
extract strings directly,
upload hashes or files to VirusTotal,
load DLLs into disassemblers,
or run static analysis tools like PEStudio.
In many cases, you don’t even need to copy the file out. That said, when running antivirus scans, it’s often safer to make a local copy to avoid quarantine issues.
If a tool fails to open a MemProcFS virtual file, a good troubleshooting step is to copy it locally and retry.
Executables, DLLs, and Drivers in Memory
Executable-related artifacts appear in multiple locations, but the closest representation of a PE file is:
pefile.dllYou’ll find this under the modules folder of the owning process.

Keep in mind:
Memory-loaded executables will never be bit-for-bit identical to their on-disk versions.
Modifications during load time are normal.
If you don’t see a process under M:\name or M:\pid, it may have already exited. You can force MemProcFS to build folders for terminated processes by setting:
M:\config\config_process_show_terminated.txt = 1
This is disabled by default because exited processes may have incomplete or corrupted data.
Extracting Drivers
Most drivers run under the System process.
You’ll find them here:
M:\name\System-4\modules\
           or
M:\pid\4\modules\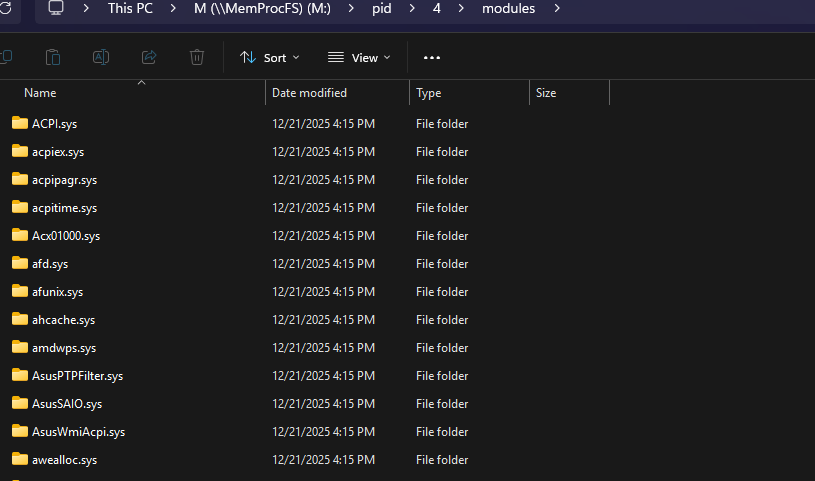
Each driver folder contains a pefile.dll representing the driver in memory.
Some graphics-related drivers (Win32k) may appear under csrss.exe, but these are rarely useful in investigations.
Process Code vs Process Data
Process memory generally falls into two broad categories:
1. Code
This closely resembles the original executable and loaded modules.
Volatility: windows.pslist --dump
MemProcFS:
M:\<PID or Name>\modules\<exe_name>\pefile.dll
This is useful for:
IOC generation
reverse engineering
validating legitimate vs malicious code
2. Data
This includes:
heaps
stacks
private memory
injected buffers
runtime artifacts
This is where you may find:
command lines
typed input
PowerShell scripts
malware configuration data
DGA output
MemProcFS Memory Dump Options
MemProcFS provides several representations:
pefile.dll – closest PE-style reconstruction
memory.vmem – represents all possible process address space (often enormous and impractical)
minidump.dmp – the most usable option for quick analysis
The minidump contains:
stack
heap
executable
loaded DLLs
…but it misses many private memory regions. It’s ideal for a first pass, while Volatility’s memmap remains the better choice for exhaustive analysis.
---------------------------------------------------------------------------------------------------------
“Thanks for reading, and join me in the next article as we continue this journey.”
-------------------------------------------------------Dean--------------------------------------------
Happy new year to everyone!!, See ya next year


Comments