
Dropzone AI Dashboard & Investigation Overview
- Nov 17, 2025
- 5 min read

Your SOC, but finally without the headache.
In the previous article, I talked about how AI is changing SOC operations forever — especially tools like Dropzone AI that automate full investigations.
If you ask me which tools I enjoy working with the most, I will always say CrowdStrike, SentinelOne, and Forensic tools. But recently, one tool has impressed me so much that I genuinely feel like every SOC team should see it at least once.
And that tool is Dropzone AI.
This Article part is all about how Dropzone actually looks and feels when you use it every day.
---------------------------------------------------------------------------------------------------------
The Dropzone Dashboard

When you open Dropzone AI, the first thing you see is the Dashboard.
And trust me — I love simple dashboards. SentinelOne has one of the best UIs, and Dropzone follows the same philosophy: clean, clear, and not overloaded.
The dashboard lets you filter investigations by:

Conclusion (Benign / Suspicious / Malicious)
Priority
Status
Source
This is super helpful when you have multiple log sources connected. You can instantly see:
Where alerts are coming from
Which tools are generating noise
Which sources need tuning
How Dropzone is handling everything in real-time
Lifetime Metrics
You also get three very important metrics:

✔ Lifetime Investigations
Total number of investigations Dropzone has done for your environment.
✔ Lifetime Median TTI
TTI = Time to Investigate. Humans take 30–90 minutes per alert. Dropzone does this in under 20 minutes.
✔ Time Saved
This is your “why am I not doing 24/7 shifts anymore” metric. This is the reason I say AI kills alert fatigue.
Response Metrics (My favourite)
This section shows:

The time between the event happening and Dropzone completing the investigation.
This is 🔥.Because humans simply cannot operate with this speed or consistency — especially at 3 A.M.
And if you want the best results?
Make sure you ingest all logs. Dropzone correlates telemetry across tools — EDR, Identity, SIEM, Cloud — and then produces a final conclusion.
More logs = more accurate investigations.
Finally, the dashboard also includes:
MITRE ATT&CK Correlation
For every alert, Dropzone maps it to relevant MITRE techniques. This is extremely helpful for understanding attacks at a glance.

---------------------------------------------------------------------------------------------------------
Fleet Dashboard — One Console for All Clients
This is a new feature and honestly a game changer for MSSPs.

If you manage many clients with different:
Domains
Tenants
Log sources
Alert volumes
You don’t need to jump into each one separately.

The Fleet Dashboard shows:
Total investigations per client
Priority breakdown
Status breakdown
High-level overview of all environments
Think of it as a master SOC console.
Important: You can only see dashboards here — not individual alerts. To analyze alerts, you still open that specific client’s workspace.

There’s also a search bar on top: Just type the client name → instantly jump into their console.
---------------------------------------------------------------------------------------------------------
Investigation Tab — The Heart of Dropzone
This is where the magic happens.
Whenever an alert comes in (CrowdStrike, SentinelOne, Panther, etc.):

Dropzone picks it up → Triaged
It starts investigation → Running
It finishes and gives a conclusion → Benign / Suspicious / Malicious
It categorizes into → Urgent / Notable / Informational
And then it’s your job to review it.
The Review Workflow
Once Dropzone gives its conclusion:
If you agree→ Approve the review→ Alert moves to Reviewed
If you don’t agree→ Add your own analysis→ Change the category (e.g., benign)

The right side shows:
Queued alerts
Running investigations
Stopped analysis (if you manually stop one)
You don’t have to babysit anything. It runs automatically in the background.
This UI is very clean — honestly easier than CrowdStrike. Dropzone feels more like SentinelOne: simple, smooth, functional.
---------------------------------------------------------------------------------------------------------
Ask a Question — AI Threat Hunting for Humans
This is hands down one of the best features.

You can ask Dropzone anything in human language, such as:


“Was this IP seen with any other user?”
“Did this hash appear anywhere else in the last 30 days?”
“Show me all failed logins from this user across all sources.”
Dropzone will go through every integrated data source:
SIEM
EDR
Identity logs
Cloud logs
Network logs
…and give you a correct answer in under a minute.
I tested it. I checked the logs manually. It was 100% correct.
Search

Result

This feature alone saves hours of manual threat hunting.
---------------------------------------------------------------------------------------------------------
Context Memory — The Brain of the SOC
This part makes Dropzone feel less like a tool and more like a human teammate.

This is one feature I truly love.
Dropzone remembers your actions and your environment context.

Example: You have a user who usually works in Europe but is traveling to the USA for 7 days.
You simply write this in human language:
“akash@cyberengage is traveling to the USA for 7 days. Login from USA is expected.”
Dropzone stores this.
Now, for the next 7 days, if the user logs in from the US, the alert will be marked benign automatically.
It learns from:
Your comments
Your decisions
Your organization context
Seriously… this is next-level SOC automation.
And the best part?
If you mark the same alert type false positive 10 times→ Dropzone will automatically mark it benign next time.
In 20,000+ investigations I observed, Dropzone never missed a true positive. It only produces false positives occasionally, and those are labeled benign — which you can simply approve.
---------------------------------------------------------------------------------------------------------
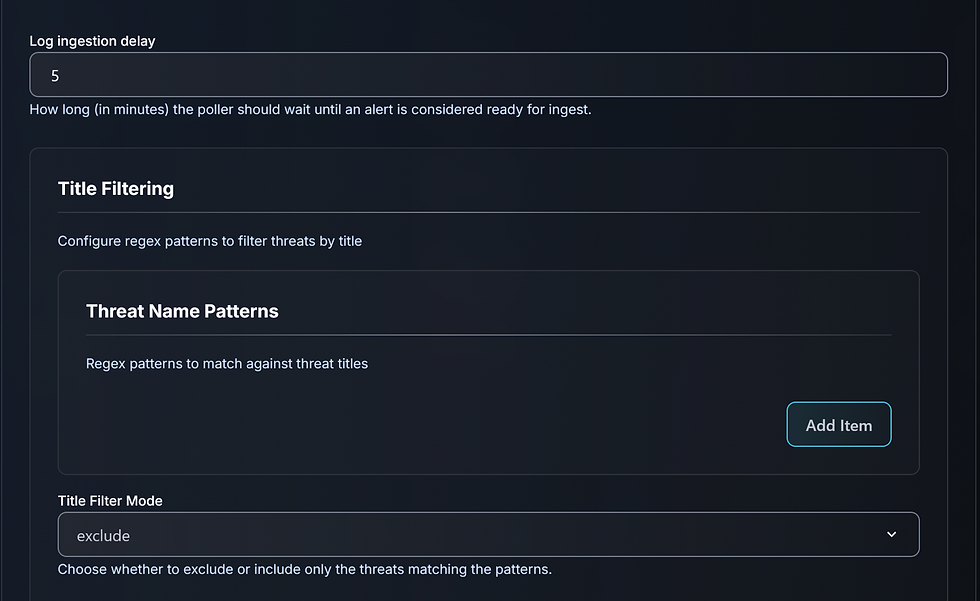
Settings — Custom Strategies, Integrations, and Response Actions

Let’s go through the most useful settings.
Custom Strategies
Think of these like “If this happens → do this” rules, but in AI style.

Example 1: EICAR Test File
If you often run EICAR tests:
You can create a strategy:
“If alert contains EICAR hash → mark as benign.”
Next time the EICAR test runs? Dropzone auto-marks it benign.
Example 2: Critical Assets
If you have crown jewels (domain controllers, VIP laptops, financial systems):
Create a strategy:

“Always mark alerts from this asset as suspicious.”
That way, analysts always review them — no risk.
Integrations

Dropzone supports easy, one-click integrations with tools like:
SentinelOne
CrowdStrike
Microsoft Defender 365
Panther
Okta
Slack
AWS
GCP
Azure…and many more.

There are three parts:

✔ Connected Apps
Which tools you’ve connected.


✔ Data Sources
Where logs are coming from.
✔ Alert Sources
Which alerts Dropzone should pick up and investigate.
If Alert Source is not enabled, Dropzone won’t triage alerts — it will only analyze data.
Alert Source Sentinel one configuration example


---------------------------------------------------------------------------------------------------------
Response Actions

This is basically notifications & automation.

You can configure Dropzone to send updates to:
Slack
Teams
Email
Custom scripts
Webhooks

Examples:
“Send me a Slack message when a malicious investigation is completed.”
“Trigger a script whenever Dropzone starts analyzing a new alert.”
This means you don’t have to keep Dropzone open 24/7.
---------------------------------------------------------------------------------------------------------
Automatic Remediation
This is extremely powerful.

If integrated with tools like Okta or Microsoft Defender auto remediation action be taken. Based on Dropzone’s conclusion.
Or you can trigger remediation manually from the investigation page — without opening the original tool.
---------------------------------------------------------------------------------------------------------
What’s Next? Alert Analysis
I know this is the part everyone is waiting for.
In the next article, I will show you:
🔥 Real investigation examples
🔥 CrowdStrike alert → Dropzone output
🔥 SentinelOne alert → Dropzone reasoning
------------------------------------Dean-----------------------------------------------------------
Check Out next article below:

Comments