

Carbon Black (P2:Dashboard/Alerts): A Practical Guide/An Practical Training
- Jul 31, 2025
- 6 min read

Carbon Black EDR (Endpoint Detection and Response) is a powerful tool, but its interface can be a little overwhelming for new users. Let me walk you through some of its key features, starting with the Dashboard and then moving on to the Alerts tab.
I’ll share what I know, with examples and screenshots for better understanding.
-------------------------------------------------------------------------------------------------------------
The Dashboard: A Quick Overview
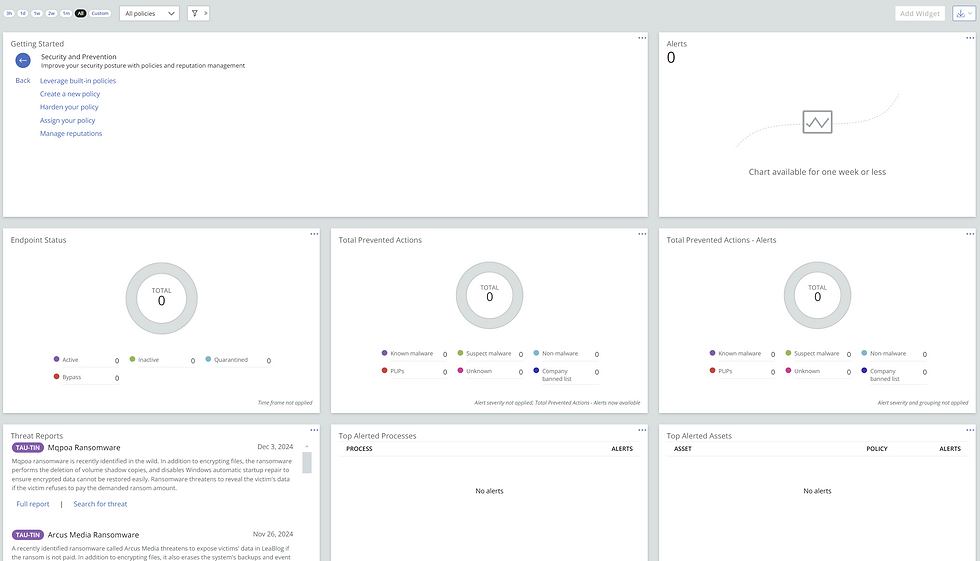
The Carbon Black Dashboard is made up of widgets that provide a high-level view of policies, alerts, and overall activity. These widgets are pre-defined, which is both a strength and a limitation. You can’t add custom widgets, which sometimes feels restrictive if you want to monitor something very specific.
Now, I’ll be honest:
I don’t personally use dashboards, whether it’s Carbon Black, SentinelOne, or any other tool. I prefer to dig into things manually. That’s just how I work. But I can see the appeal of dashboards for administrators who want a quick overview. If you’re someone who relies on dashboards, the widgets here are decent, though not customizable.
Since the visuals speak for themselves, I won’t go into great detail. You’ll understand everything through the screenshots.
-------------------------------------------------------------------------------------------------------------
Moving to the Alerts Tab
Now, let’s dive into the Alerts tab. This section is much more interactive and flexible. Here's a quick breakdown:

The Search Bar
At the top of the Alerts tab, you’ll find a search bar where you can look up alerts based on parameters like:
File name
Device ID

Hash
For example,
if you type de in the search bar, it will auto-fill suggestions like "Device ID" or "Policy Name," making it easier to refine your search. Similarly, you can search by hash or file name.
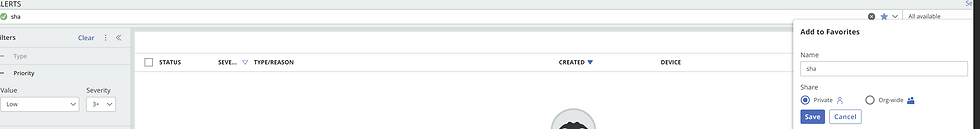
One great feature is that after performing a search, you can save the filter and add it to your favorites. This way, you don’t need to repeat the same search every time.
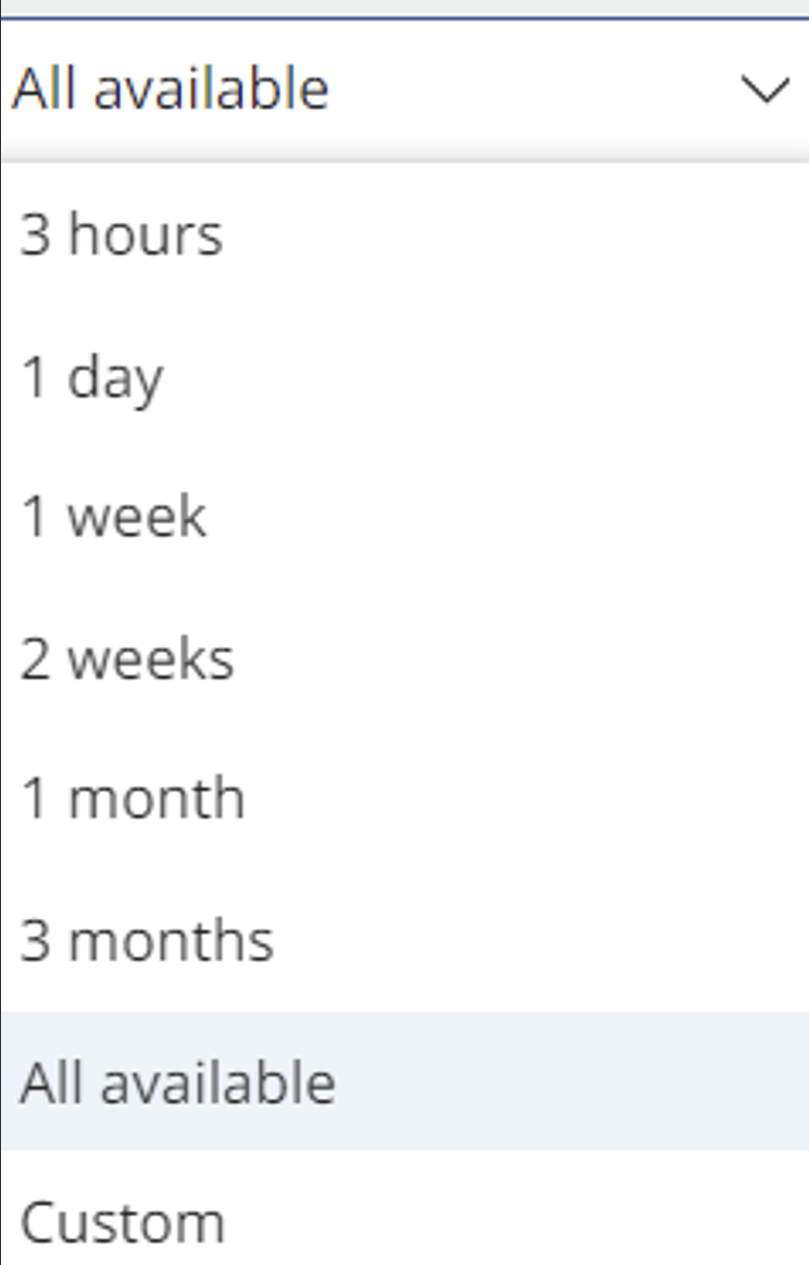
Time Filters
On the right-hand side, there’s a time filter where you can choose to view alerts for a specific period, such as the past day, hour, or month.
-------------------------------------------------------------------------------------------------------------
Filters/Grouping/Search Guide Options
On the left-hand side, you’ll see additional filters to make searching alerts easier. You can filter by Type, Priority, and more.

Now if u see Top right hand side you will see option
Group By

None: Alerts are shown individually, one by one.
Threat ID: Groups alerts that share the same threat ID. For example, if multiple alerts are related to a remote tool, selecting "Threat ID" groups them together for easier viewing.
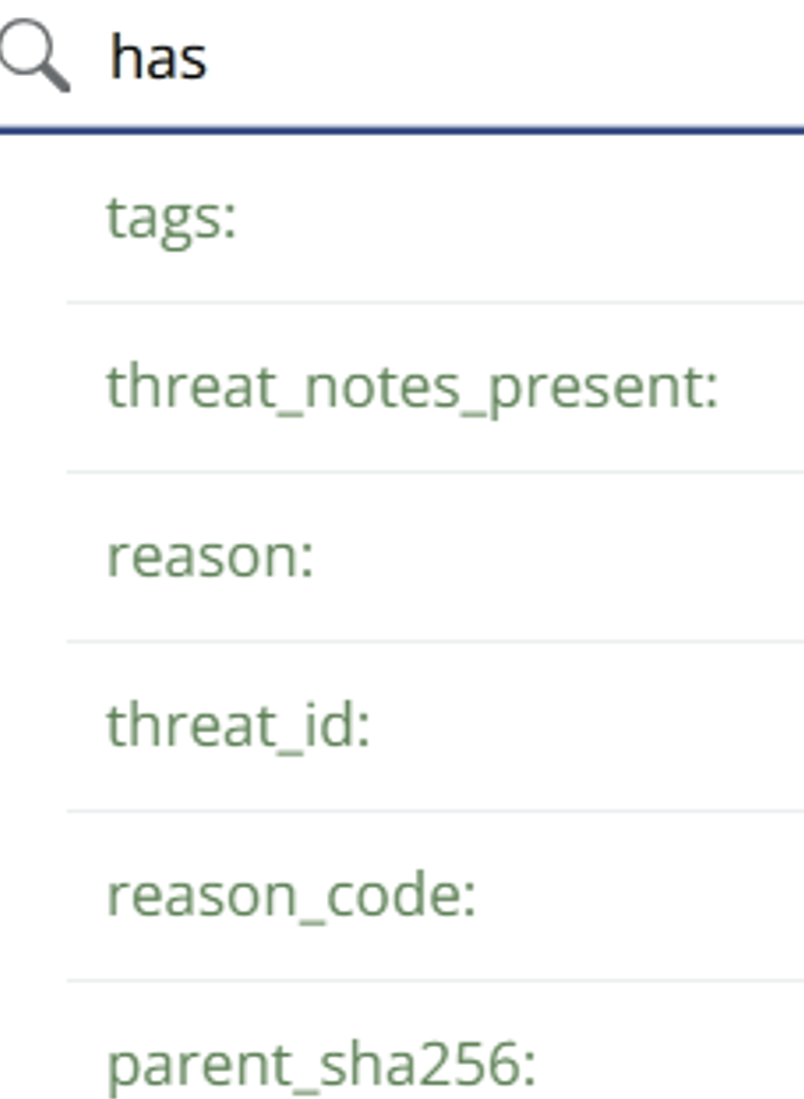
Search Guide
One of my favorite features in the Alerts tab is the Search Guide link at the top. If you click on it, you’ll find a detailed guide on how to search using the bar. It’s incredibly useful if you’re not familiar with the search syntax or want to refine your searches further.

View of search Guide:

-------------------------------------------------------------------------------------------------------------
Types of Alerts
Let’s now look at the types of alerts in Carbon Black. There are two main categories:

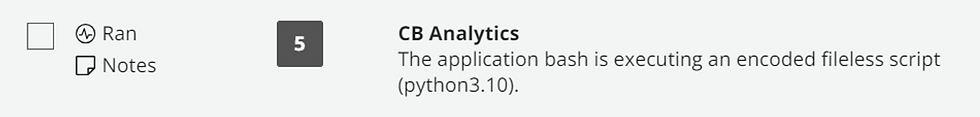
CB Analytics:-
These alerts are generated automatically by the Carbon Black Cloud analytics engine. They are essentially detections based on built-in analytics.
Watchlist Hits:-
Watchlist hits are rule-based detections. For instance, if you’ve set up a rule to monitor for certain IOCs (Indicators of Compromise), any matches will trigger an alert under this category.
According to the official documentation:
Watchlists are saved searches that run periodically against process or binary data in Carbon Black EDR. They run every 10 minutes and notify users when new results are found.
Filter by Priority
One of the key filters available is Priority Level. You can use this to narrow down alerts based on their assigned priority. For example, you might only want to focus on high-priority alerts. Once you apply this filter, only the relevant alerts matching that priority will show up. It’s a simple yet effective way to zero in on what needs immediate attention.
More filter screenshot:

Group By: None vs. Threat ID
As I mentioned earlier, the Group By filter can be set to either:
None: This displays alerts individually, one by one.
Threat ID: Groups alerts that share the same threat ID. For instance, if multiple alerts relate to a "Remote Tool" threat, grouping by Threat ID will cluster them together.
Below, you’ll see screenshots showing both options:
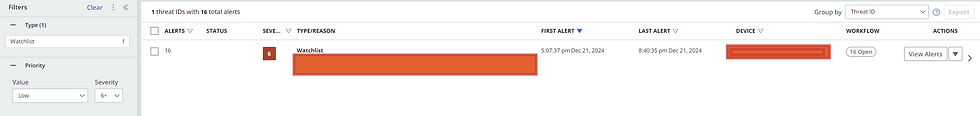
Group By None: Each alert appears separately.

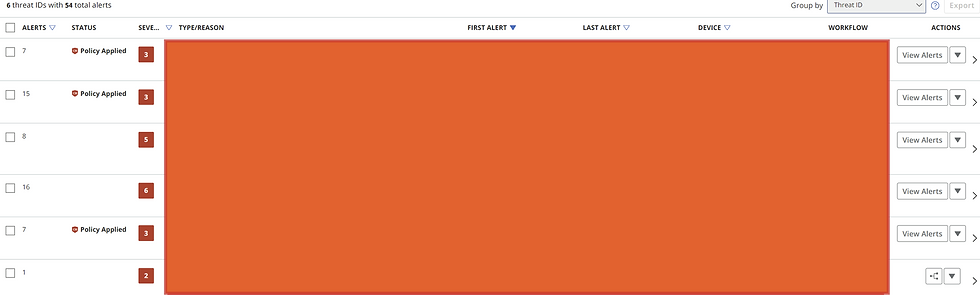
Group By Threat ID: Similar alerts are grouped, which makes it easier to analyze related threats.
-------------------------------------------------------------------------------------------------------------
Diving Into a Particular Alert
Let’s take a closer look at a specific alert, starting with a Watchlist Hit. Here’s what you’ll find in a typical alert:

Arrow for Detailed View
Next to the Actions section, there’s an arrow (>) that you can click to expand the alert. This will reveal more information about the alert, including its Alert ID and the Reason it was triggered.
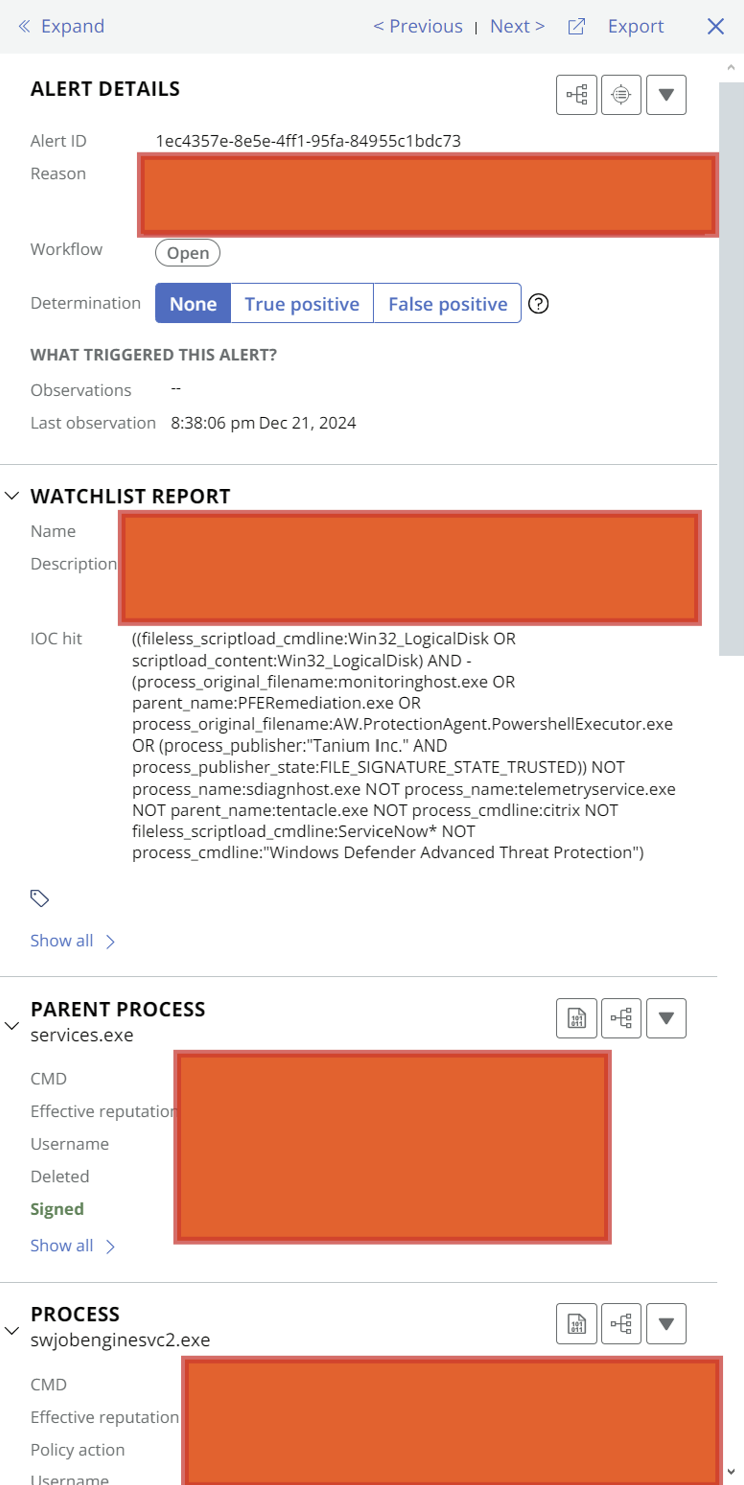
Alert ID: This uniquely identifies the alert.
Reason: Indicates the watchlist or rule that triggered the alert. For instance, if you’ve set up a rule to detect IOC hits, you’ll see the corresponding rule listed here.
Processes and Parent Processes

Below the basic alert details, you’ll see the Parent Process and Process information. This shows the process chain for the activity that triggered the alert. I won’t spend too much time explaining these since most of us are familiar with how processes and parent processes work.
If you need even more details, there’s a Show All button that you can click to expand and view additional process information.
Remediation Steps
After the process details, you’ll find Remediation Steps. This section suggests actions you can take in response to the alert, such as:

Deleting the application
Quarantining the asset
Taking remote actions on the device
Device Details
Just below the remediation steps, you’ll find a section for Device Details, which provides information about the endpoint where the alert was triggered. This can include the device name, OS version, and other critical details.
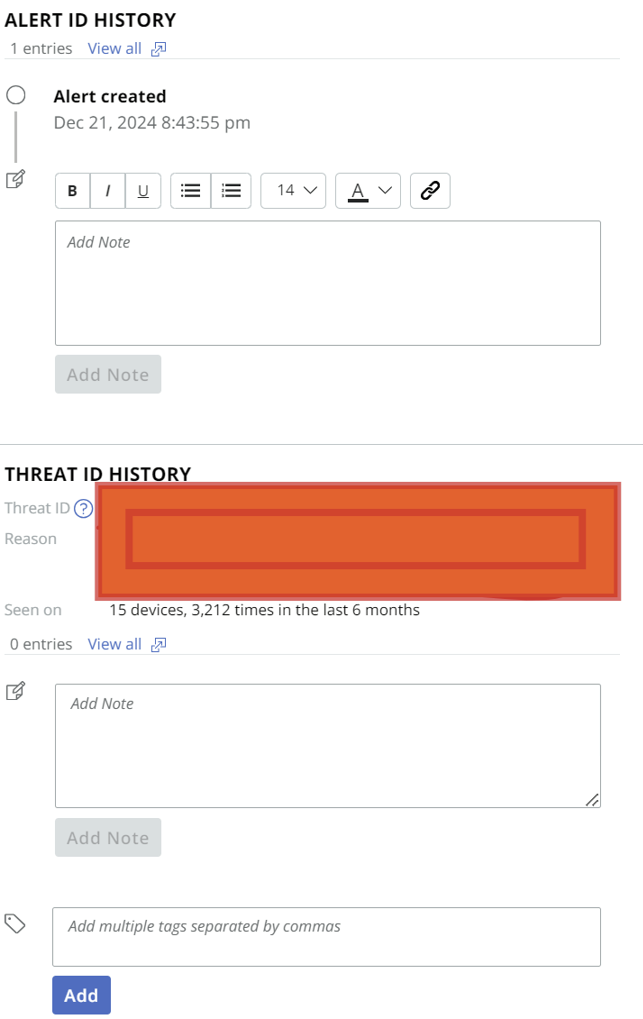
Threat History
Scrolling further down, you’ll come across the Threat History section. This provides context on how often similar alerts have been detected across devices, helping you understand the scale of the issue.
-------------------------------------------------------------------------------------------------------------
No Need to Scroll: Use the Expand Option
Instead of scrolling through the alert details, you can use the Expand button at the top of the alert.

Clicking this will display all the alert details on a single page, saving you time and making it easier to view everything at once.

-------------------------------------------------------------------------------------------------------------
In depth Analysis of alert and view:
Process Analysis: A Visual Insight

If you want to investigate an alert beyond just the basics like hash, IOC, or file paths, Process Analysis is your go-to tool.
When you select Process Analysis, the first thing you’ll notice is a graphical representation.
This graph visually lays out the parent-child process relationships, making it easy to trace back how the suspicious activity started and its subsequent actions.
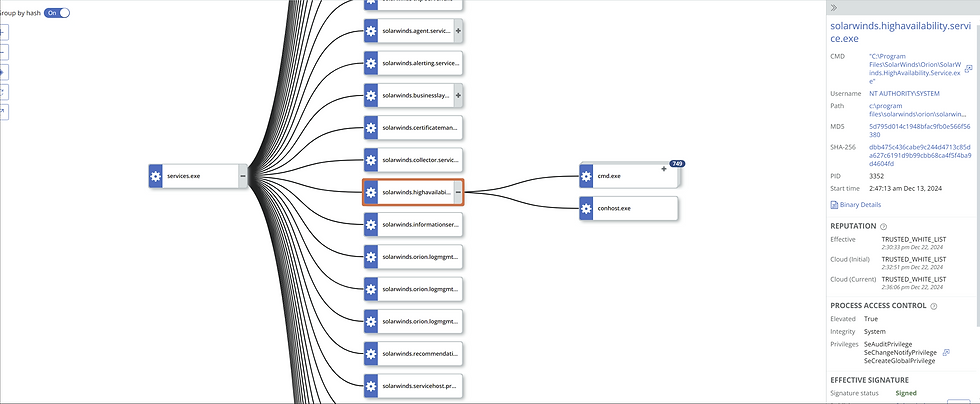
Screenshot Example: The graph provides clarity on which process initiated the activity, its children, and the sequence of events. It’s particularly helpful for identifying anomalies in the execution chain.
Filters and Modules
As you scroll down, you’ll find additional filters, including details like:

Loaded Modules: Shows the DLLs or components loaded by a specific process.
File Modifications: Lists changes made to files.
Registry Modifications: Displays registry edits made by the process.
These are standard features in most EDR tools, but Carbon Black makes the information easy to navigate.
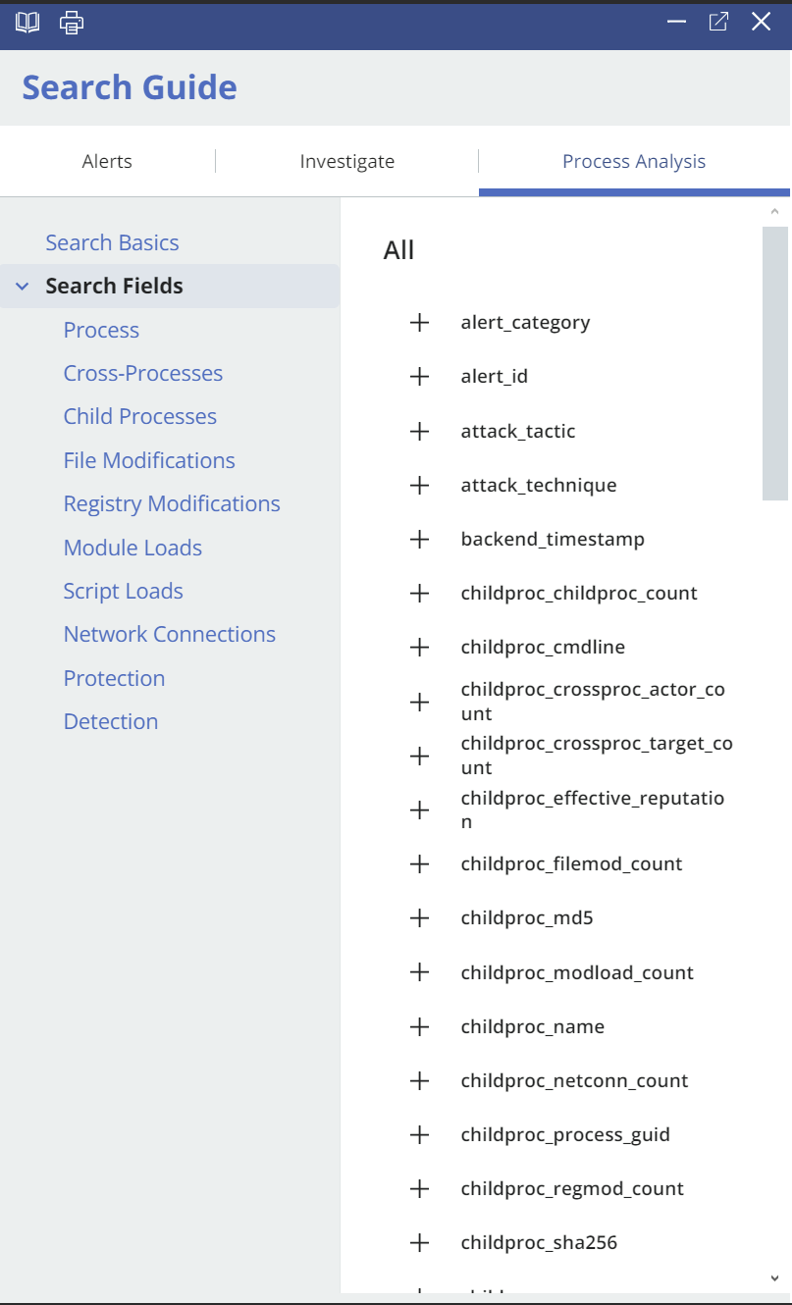
Search Guide
At the top-right corner of the process analysis section, there’s a Search Guide link. If you’re unsure about analyzing alerts, this guide provides handy tips and examples. It’s a quick way to get familiar with the interface and techniques.
-------------------------------------------------------------------------------------------------------------
CB Analytics Alerts
Now, let’s shift to CB Analytics Hits, another type of alert you’ll encounter.
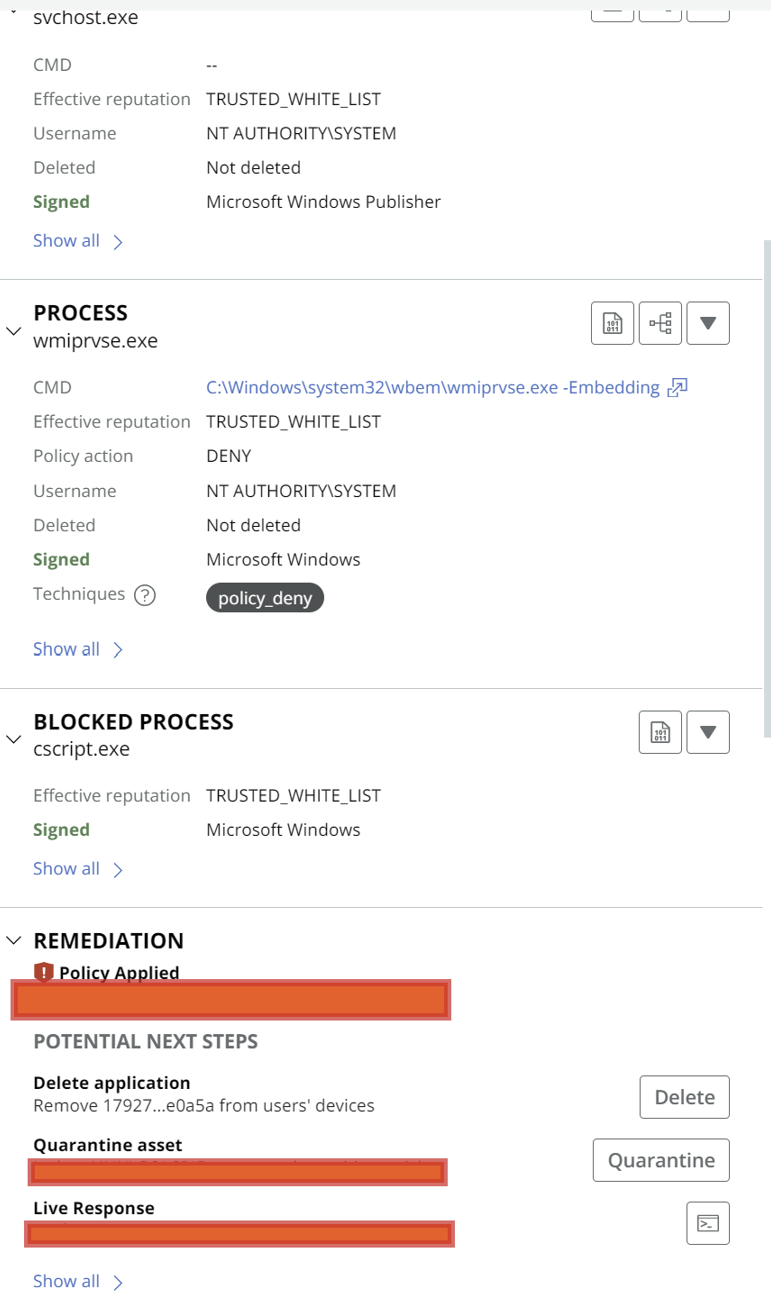
Blocked CB Analytics Alerts
Let’s say Carbon Black detects a suspicious process like wmiprvse.exe invoking another application. If you’ve created a policy to block this activity, Carbon Black will:
Detect the activity.
Apply the policy and block the process.

In the alert details, you’ll see that the policy was enforced. This is similar to a Watchlist Hit, but with the key difference being that the threat was actively blocked.

Non-Blocked CB Analytics Alerts
On the flip side, if there’s no policy in place to block the suspicious activity, Carbon Black will still flag it as worth investigating.
For example, Carbon Black might detect another application but not block it because there’s no policy for that scenario.
The alert details in this case will look similar to a watchlist hit, allowing you to analyze and decide on the next steps.
-------------------------------------------------------------------------------------------------------------
Takeaways on Alerts
That’s essentially how the Alerts Tab works.
From using filters to navigating process analysis graphs, you have all the tools to investigate and take action.
Don’t forget, if you ever feel stuck, the Search Guide is always there to assist.
If there’s enough interest, I’ll create a dedicated article on how to analyze alerts in detail.
But for now, let’s move on to the next topic—I’ve got more articles to write (lol).
Upcoming article : Carbon Black (P3:Investigate): A Practical Guide/An Practical Training
Dean

Comments